

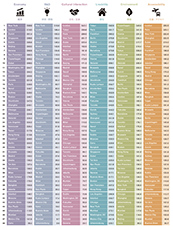
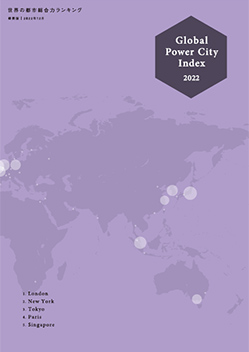
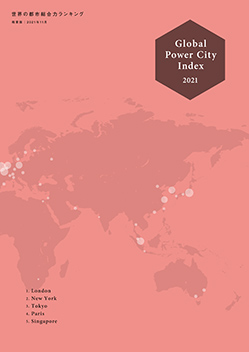
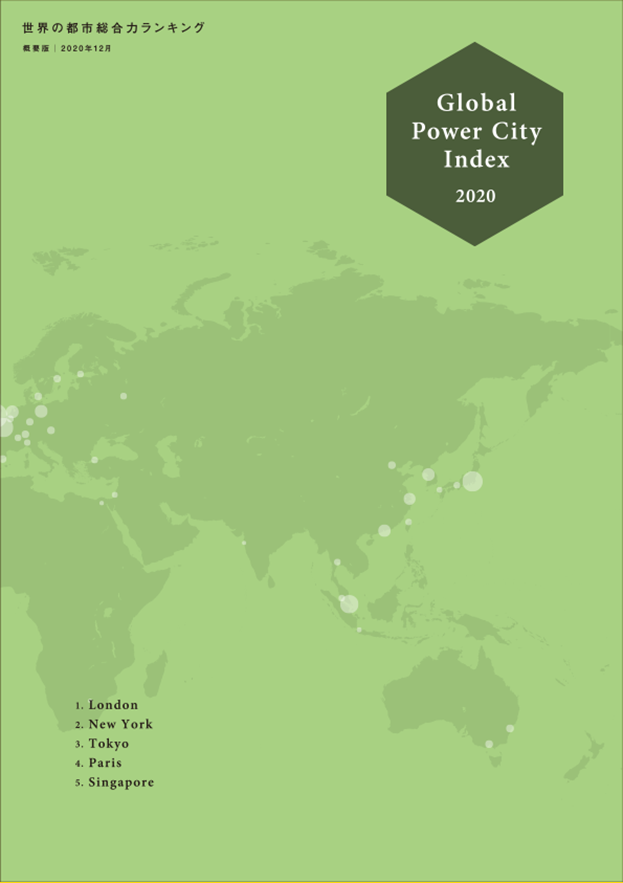
GPCI-2025 Financial Centers
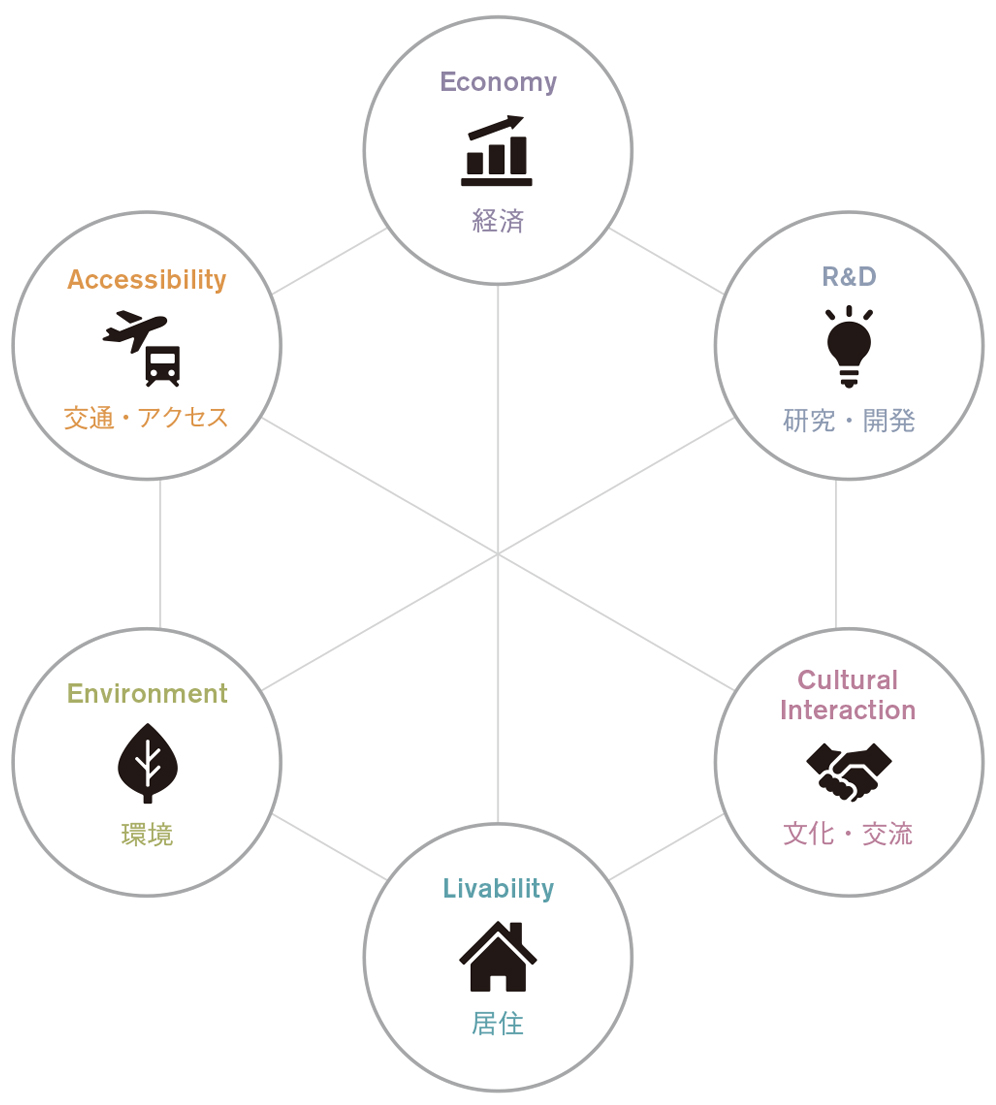
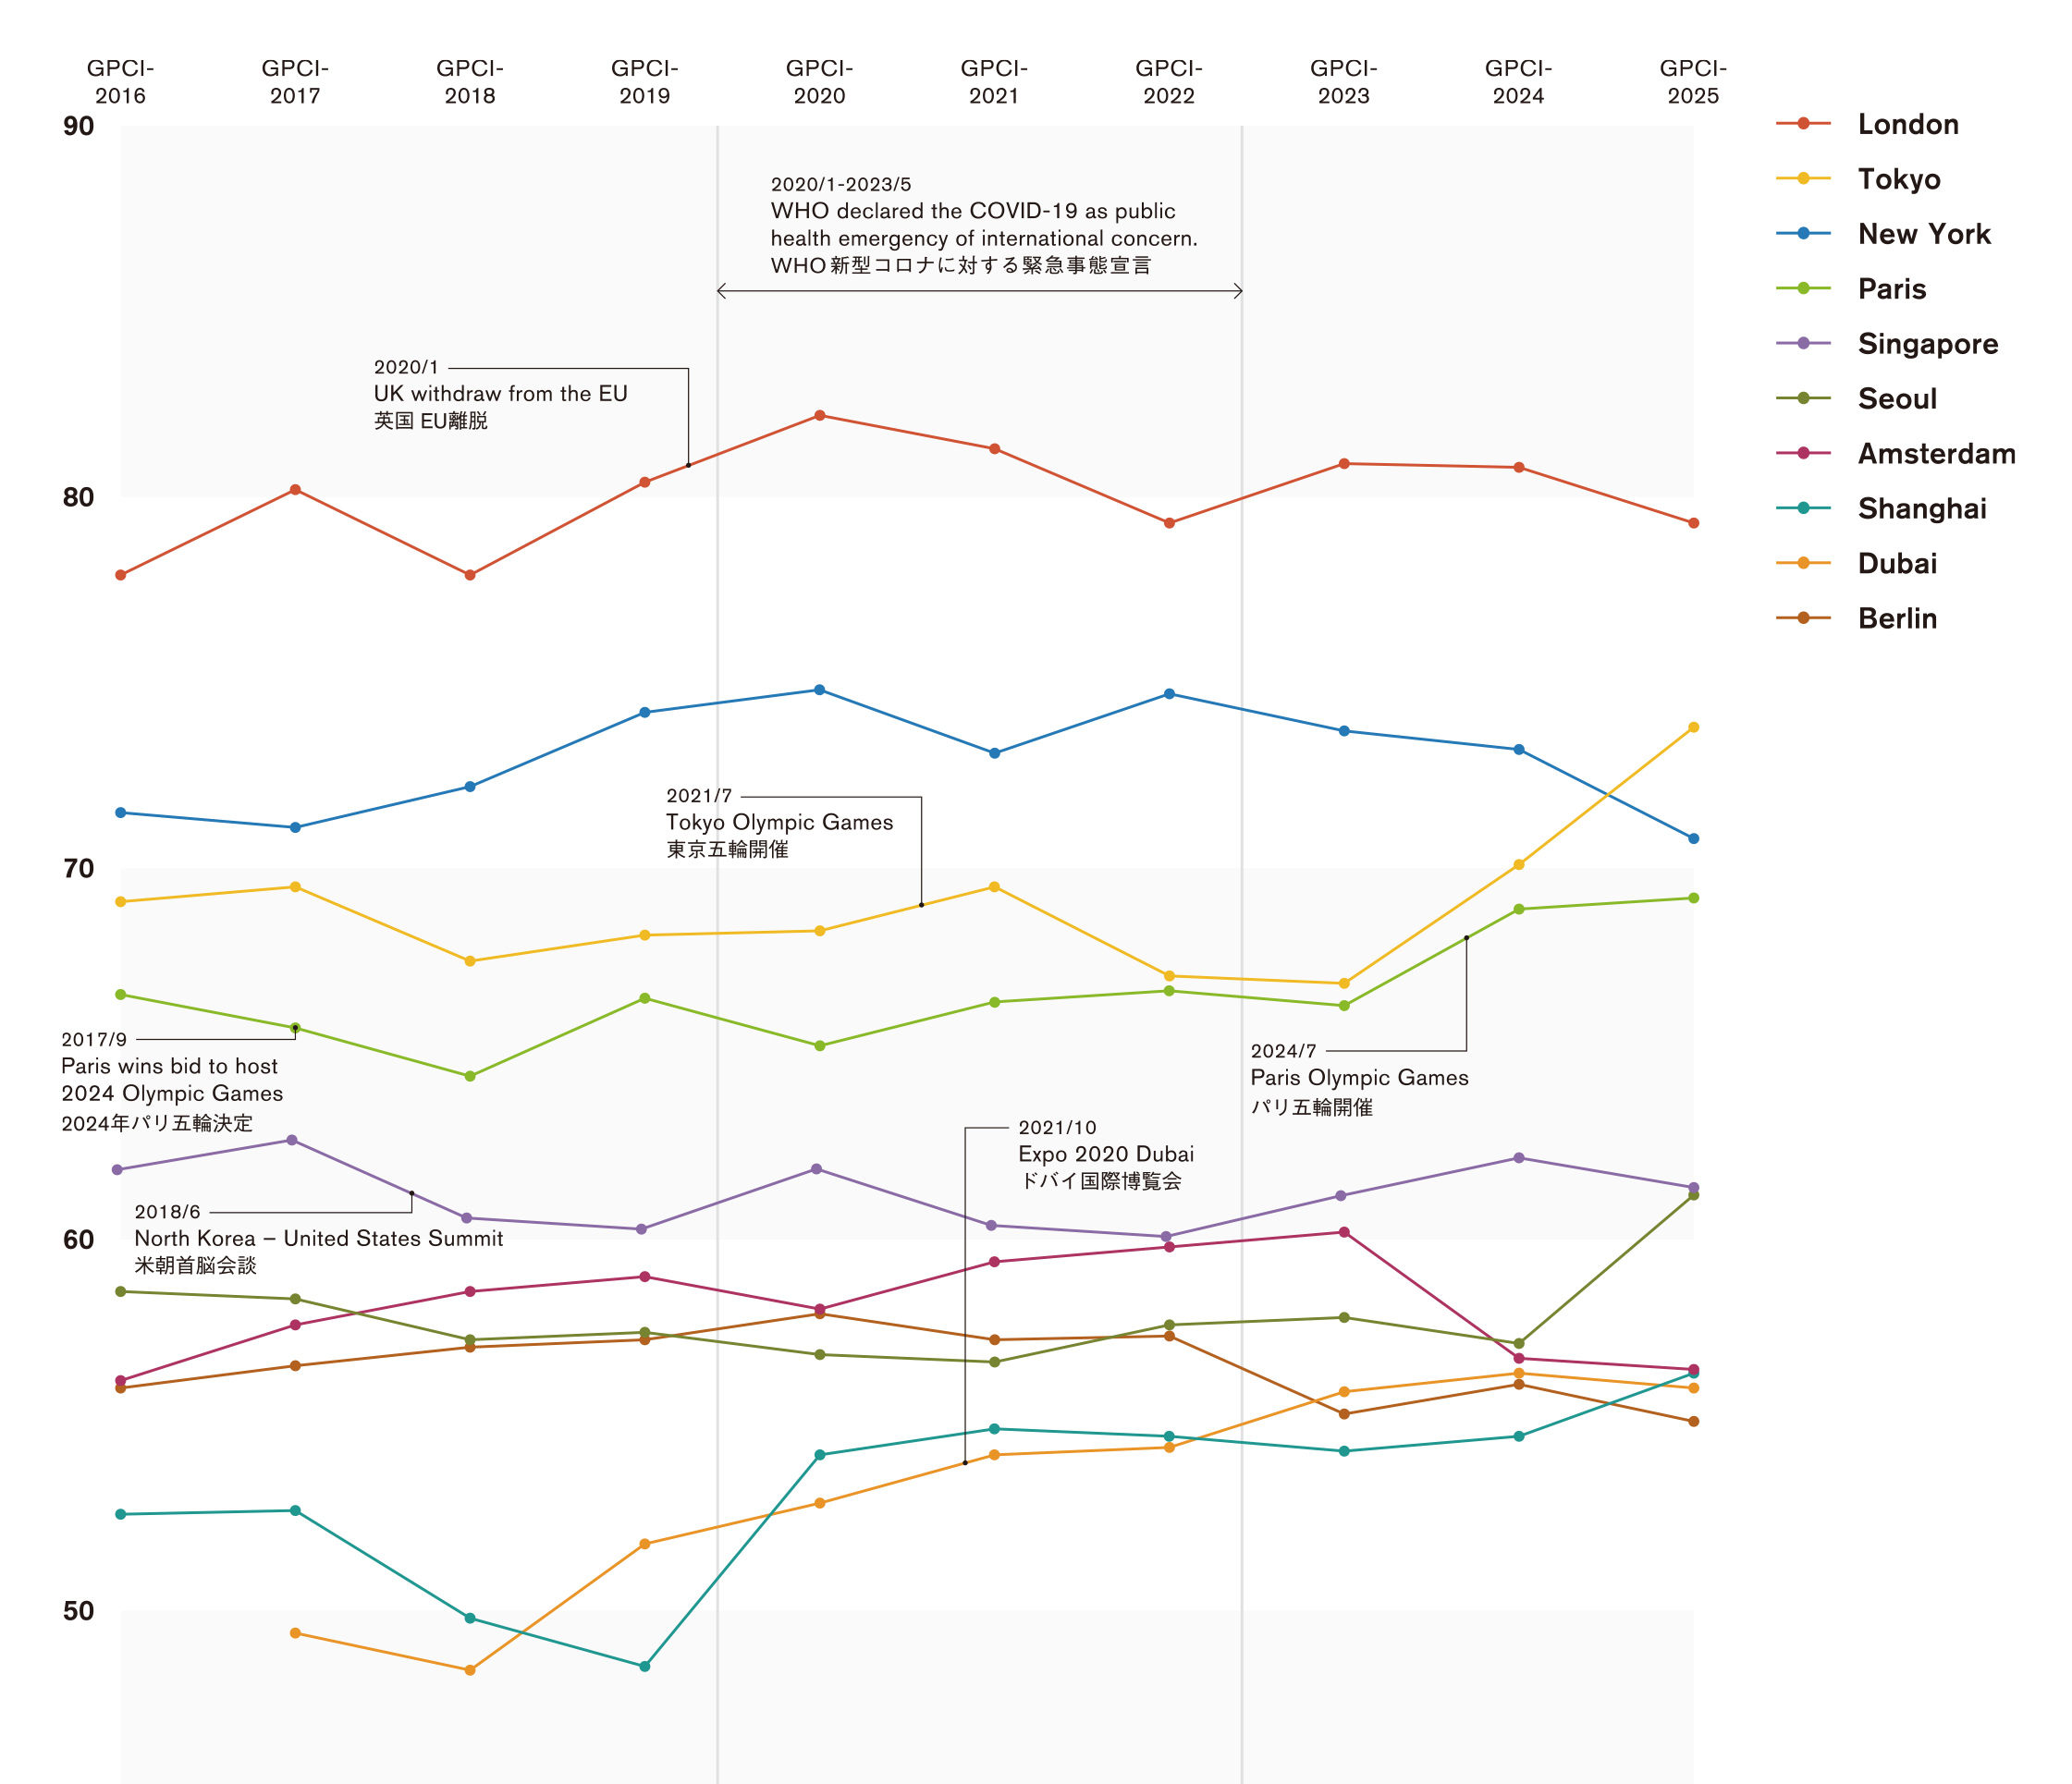
The Global Power City Index - Financial Centers (GPCI-Financial Centers), we evaluate the competitiveness of cities as international financial centers from a multifaceted perspective by adding “Finance” function to the six functions of the Global Power City Index (Economy, Research and Development, Cultural Interaction, Livability, Environment, and Accessibility). This allows us to uncover the characteristics, strengths, and weaknesses of each city as a financial center within the global financial system and rank them.
Comments from Key Urban Leaders
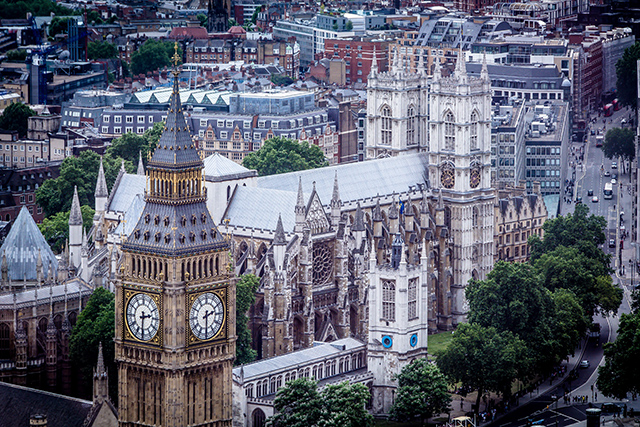
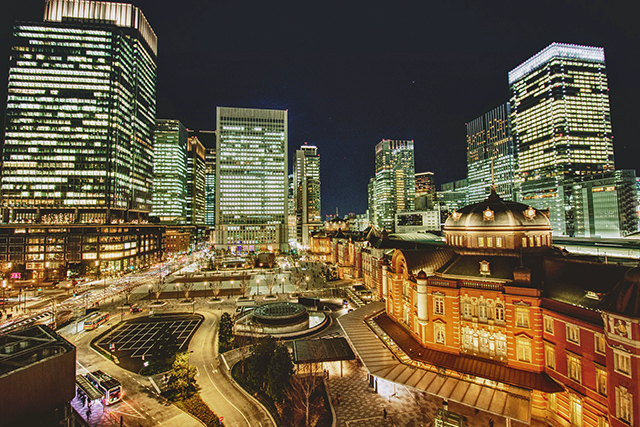
Tokyo’s diverse charms are traditions carried on from the Edo period which coexist with modern sensibilities and have attracted many foreign travelers. In Tokyo, visitors can enjoy “culinary delights” such as traditional Japanese cuisine, including sushi, together with those from around the world. Tokyo has also captivated the world with its “entertainment.” A projection mapping using the Tokyo Metropolitan Government Building, which symbolizes the city’s nighttime tourism, anime and manga rooted in Edo-period ukiyo-e, and traditional performing arts and sports, such as kabuki and sumo.
In addition, Tokyo has a global reputation for public safety with low crime and terrorism risks. Tokyo is a city where lost wallets are highly likely to be returned intact. Its pleasant urban environment includes clean streets with hardly any litter. Also, the city’s abundant potential includes advanced GX technologies, the presence of one of the world’s largest financial markets, and clusters of startups and so forth have further enhanced the opportunity for new economic growth.
While the impacts of climate change become increasingly serious, we are moving forward with the creation of a resilient city strengthened in preparedness. Tokyo’s resilience serves as the foundation for various urban activities for people to lead their daily lives with peace of mind.
We are in times of turbulence. The Tokyo 2020 Games, the World Athletics Championships Tokyo 25, and the Tokyo 2025 Deaflympics have shown the boundless potential of “people” again. By utilizing people’s immense potential, and the wisdom and ideas accumulated in Tokyo, our city will further implement initiatives to create a city in which everyone can pursue their own self-fulfillment and happiness.
Koike Yuriko
Governor of Tokyo
Seoul is a city driven by an inherent DNA of innovation and progress, marked by a singular dynamism that generates its own momentum even in the midst of a rapidly transforming world. The convergence of cutting-edge technology and vibrant cultural energy has propelled the global expansion of K-culture, becoming a powerful engine that underpins Seoul’s global competitiveness.
The world today is undergoing profound shifts shaped by the climate crisis, demographic transformation, and the emergence of the AI era. With “accompanying the vulnerable” as its central value, Seoul is safeguarding the lives of its citizens and sustaining resilient growth through times of change. At the same time, the city is strengthening the foundations of everyday life through life-cycle care and welfare, housing stability, and improved mobility, while also reforming regulations that create inconvenience and making forward-looking investments in future industries such as AI, transforming crises into opportunities for renewed progress.
In the years ahead, Seoul will further reinforce the essential foundations that define everyday life, including housing, safety, health, welfare, and culture, to realize a people-centered inclusive city where all citizens can enjoy fair opportunities even in an era of change. With public trust as its highest value, Seoul will continue to grow into a city that is ever more competitive on the global stage, “a Seoul where citizens are happy.”
The insights offered by GPCI will serve as a vital compass as Seoul translates this vision into action and advances as a truly future-oriented city.
Oh Se-hoon
Mayor of Seoul
Dubai’s vision for the future of cities is rooted in a belief that people, culture, and innovation are the true engines of progress. Guided by a clear and ambitious strategy, Dubai continues to evolve as a city where ideas are accelerated, and diverse communities can thrive; our ability to attract and nurture global talent, invest in cutting-edge sectors, and build world-class infrastructure has strengthened the city's position as a leading global hub for opportunity and creativity.
As cities navigate an era of rapid technological change and new expectations for quality of life, Dubai remains committed to shaping an urban environment that is agile and inclusive. We prioritise cultural vitality, sustainability, digital transformation, and economic competitiveness, ensuring that Dubai is a city that inspires. We will continue to champion global collaboration, support emerging industries, and cultivate a vibrant ecosystem where innovation and culture come together to shape the next chapter of urban excellence.
Her Highness Sheikha Latifa bint Mohammed bin Rashid Al Maktoum
Chairperson of the Dubai Culture and Arts Authority, Member of the Executive Council of Dubai, and Member of the Dubai Council.
Berlin is the city of freedom and tolerance – a place open to the world. People from approximately 190 nations live in our city, which has developed into an outstanding center for startups in recent years. Many young people from around the globe come to Berlin to found innovative companies. These startups are establishing themselves in areas like digital transformation, mobility, energy, healthcare, and the environmental industry. Berlin is already the German fintech capital – and it offers entrepreneurs excellent opportunities to develop new ideas and establish themselves in the market.
Our goal is to become Europe’s number one location for innovation. To do so, we will invest billions over the coming years in education and research, environmental and climate action, and mobility. In Berlin, new ideas are always welcome.
Kai Wegner
Governing Mayor of Berlin