Institute for Urban Strategies

> About us

> Japanese

Japan Power Cities

While the world's population is predicted to keep on growing in the years ahead, the population of Japan is expected to shrink rapidly as a result of a declining birth rate and an aging society. In facing such circumstances head on, cities across Japan, in order to maintain their dynamism, must harness their respective characteristics and push ahead with urban development, while maintaining the “magnetism” required to attract people and companies, as well as the “growth potential” that continually demonstrates their urban appeal and strengths. In the “Japan Power Cities–Profiling Urban Attractiveness”, a comparative and multi-faceted analysis of the strengths of the major cities of Japan was conducted to shed light on city characteristics such as strengths and attractiveness in the hope of contributing to the formulation and execution of an urban strategy plan.

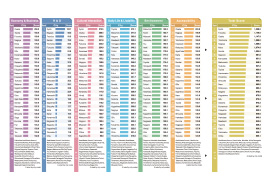
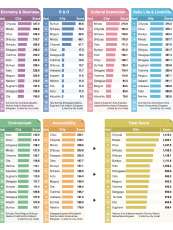
Japan Power Cities 2019 Summary

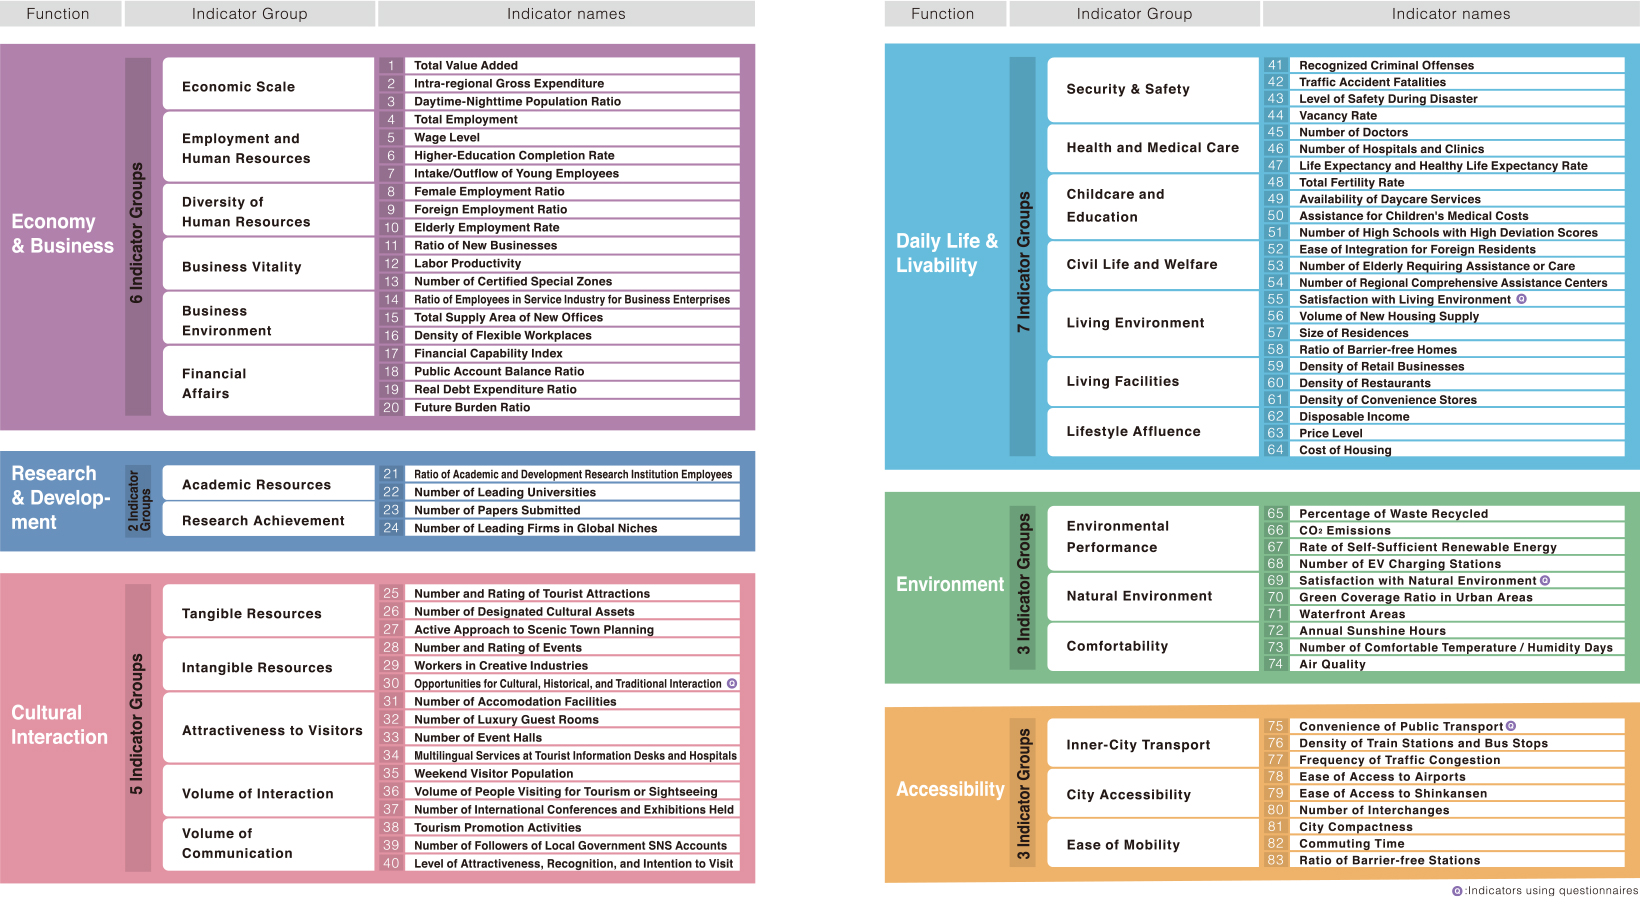
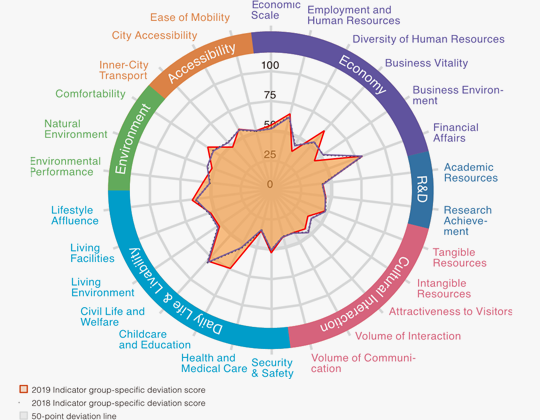
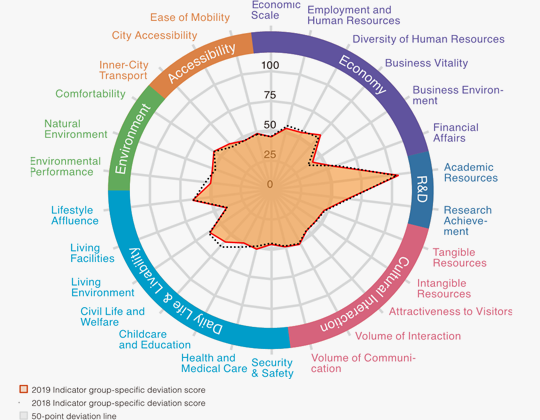
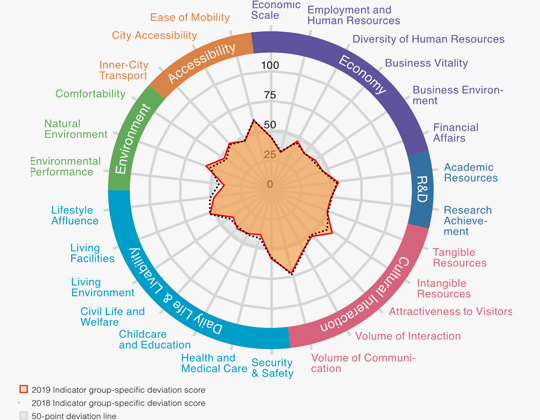
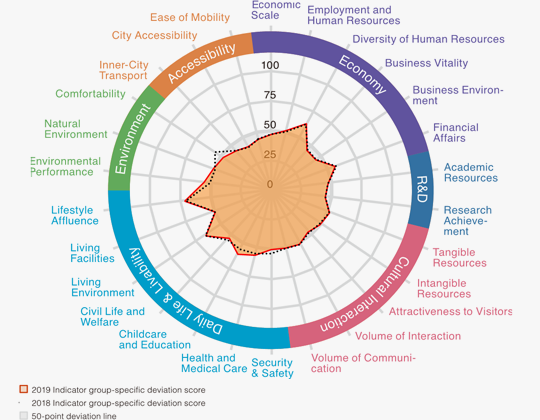
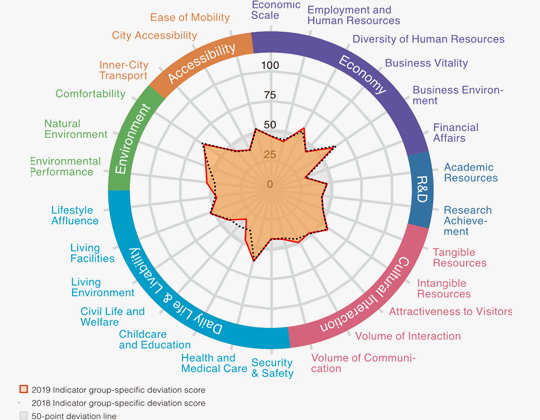
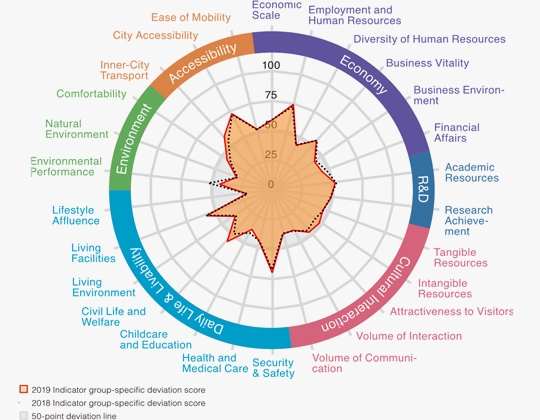
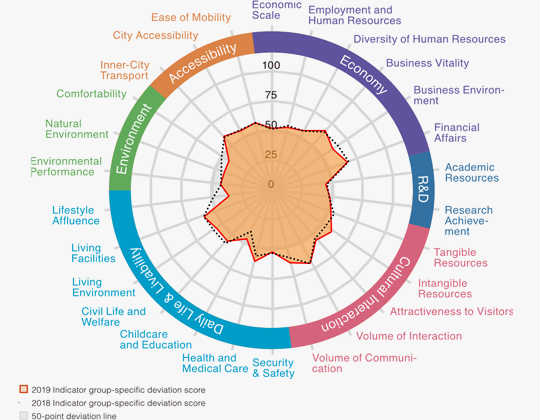
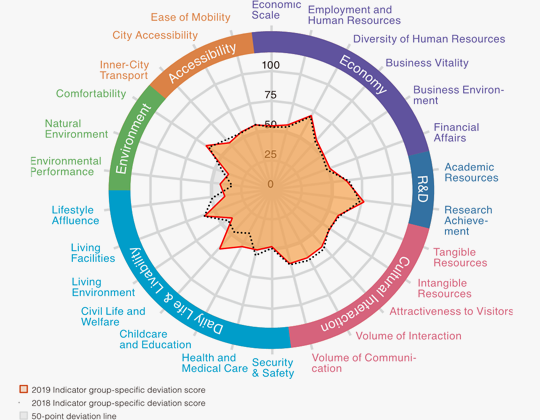
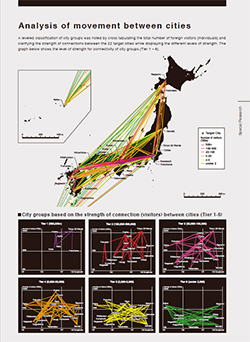
This summary includes the background & objective, the evaluation methodology of the study, the data tables, and the 2019 results & analysis. The results & analysis features radar charts of specific cities and a cluster analysis of all target cities. The in-depth report of this study will be published in “Japan Power Cities Databook 2019”, available in October, 2019 (Japanese only).

Key Features

Target Cities

72 major Japanese cities and the 23 wards of Tokyo were included as target cities in this study. Regarding the selection of the target cities, first a list of top 3 cities by population in each prefecture, or administrative region, is created. Next, from that list, 1) Ordinance-designated cities and 2) Prefectural capitals were selected. Finally, in addition to cities from 1) and 2), cities with a population of more than 200,000 and a daytime-nighttime population ratio of more than 1.0 for those located within Japan's big three metropolitan areas, or more than 0.9 for cities elsewhere, were selected.

Evaluation Methodology

In Japan Power Cities, 6 functions (Economy & Business, Research & Development, Cultural Interaction, Daily Life & Livability, Environment, and Accessibility) were created to represent the components of cities. Furthermore, 26 indicator groups were established to represent the primary components of those functions, with 83 indicators finally being determined.

Function / Indicator Group / Indicator

zoom

Results Results

Radar charts and bar graphs were used to clarify the strengths and attractiveness of each target city in this study. The following are the examples of particularly unique cities, six of which are from a 72 major Japanese cities and three from the 23 wards of Tokyo.

72 major cities: Unique city example

Toyota

A sustainable city where people
and industries live harmoniously

Toyota

Tsukuba

A smart-garden city
with emerging innovations

Tsukuba

Hakodate

Striving for well-rounded economic activity
and strong appeal “Cross-roads of the North”

Hakodate

Nagano

Possessing diverse environments
and ease of living “A city of contentment”

Nagano

Kochi

A city integrated with the environment,
filled with an abundance of nature

Kochi

Kawasaki

The urban industrial core of Tokyo-Yokohama
with excellent transportation convenience

Kawasaki

23 wards of Tokyo: Unique city example

Shibuya

A cosmopolitan city that continues to progress flexibly
while valuing diversity and individuality

Shibuya

Shinjuku

A bustling city that attracts a variety of talent
from both inside and outside the country

Shinjuku

Koto

A city leveraging its waterways and protecting
its abundant environmental resources

Koto

In the Databook 2019, you can find a city's characteristics through different data forms including indicator group-specific radar charts.

Special Research
Spatial Connectivity Analysis of the Movement of Foreign Visitors to Japan
~Mobile Spatial Statistics Data Analysis ~

This investigation aims to contribute to future strategic plans for tourism in individual cities by visualizing the movement of foreign tourists between the JPC target cities and through that clarifying the potential or challenges that each city faces from the viewpoint of tourism.

You can find the summary and results of this research on p.20-24.

Japan Power Cities 2019: Tokyo Tama

In addition to the 23 wards in Tokyo covered by Japan Power Cities, 6 others cities within Tokyo—Tama, Machida, Hachioji, Fuchu, Musashino and Tachikawa—were selected for study in this supplementary research.

※This version (Japanese only) is not included in Japan Power Cities Databook 2019 (expected release of October 2019).

JPC 2019 tama

Press Resources

  • Summary

    PDF Download

  • Function-Specific Scores:
    72 Major Cities

    JPEG Download

  • Function-Specific Scores:
    Tokyo 23 Wards

    JPEG Download

Japan Power Cities Databook 2019
City characteristics of 72 major cities of Japan and 23 wards of Tokyo are revealed!

Release date
Print Edition & PDF: expected release of October 2019
Size
A4
Language
Japanese only
Price
Print Edition: JPY 30,000 (tax excluded)
PDF: JPY 24,000 (tax excluded)
Contents Introduction
Methodology
Results & Analysis
City Profiles
Data Tables
Reference
Japan Power Cities Databook 2019

Contact

For enquiry about Japan Power Cities 2019, please contact to iusall[AT]mori-m-foundation.or.jp