Japan Power Cities 2020 Summary
This is a summary version of "Japan Power Cities DATABOOK 2020." Introduced are partial results and analysis for 2020 using easy-to-understand charts, as well as indicator definitions.
While the world's population is predicted to keep on growing in the years ahead, the population of Japan is expected to shrink rapidly as a result of a declining birth rate and an aging society. In facing such circumstances head on, cities across Japan, in order to maintain their dynamism, must harness their respective characteristics and push ahead with urban development, while maintaining the “magnetism” required to attract people and companies, as well as the “growth potential” that continually demonstrates their urban appeal and strengths. In the “Japan Power Cities–Profiling Urban Attractiveness”, a comparative and multi-faceted analysis of the strengths of the major cities of Japan was conducted to shed light on city characteristics such as strengths and attractiveness in the hope of contributing to the formulation and execution of an urban strategy plan.
Japan Power Cities 2020 Summary
This is a summary version of "Japan Power Cities DATABOOK 2020." Introduced are partial results and analysis for 2020 using easy-to-understand charts, as well as indicator definitions.
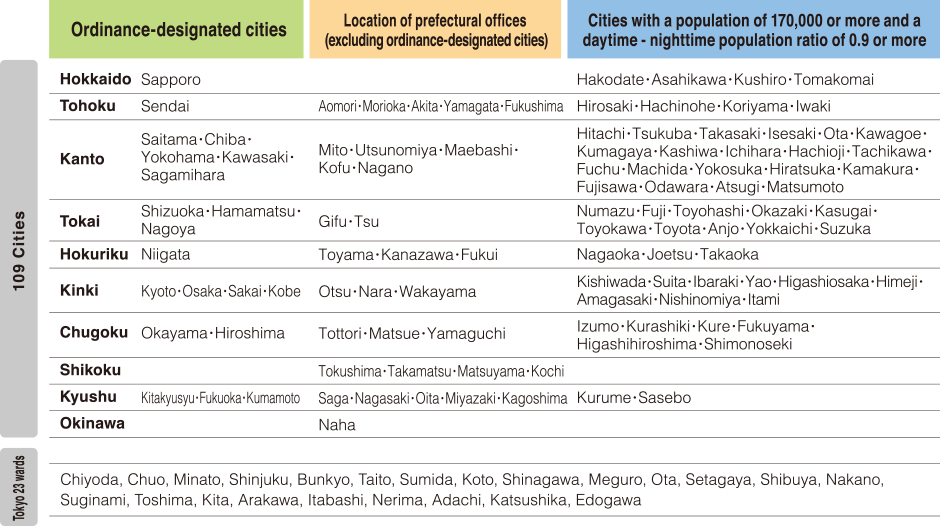
109 Japanese cities and the 23 wards of Tokyo were included as target cities in this study. For the 109 cities, the selection criteria were set as follows and the cities were selected:
1. Ordinance-designated cities.
2. Location of prefectural offices (excluding ordinance-designated cities.)
3. Cities with a population of 170,000 or more and a daytime - nighttime population ratio of 0.9 or more.
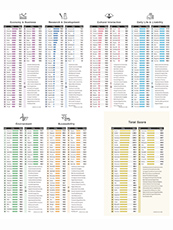
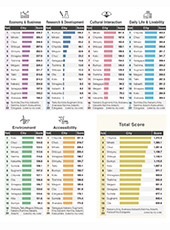
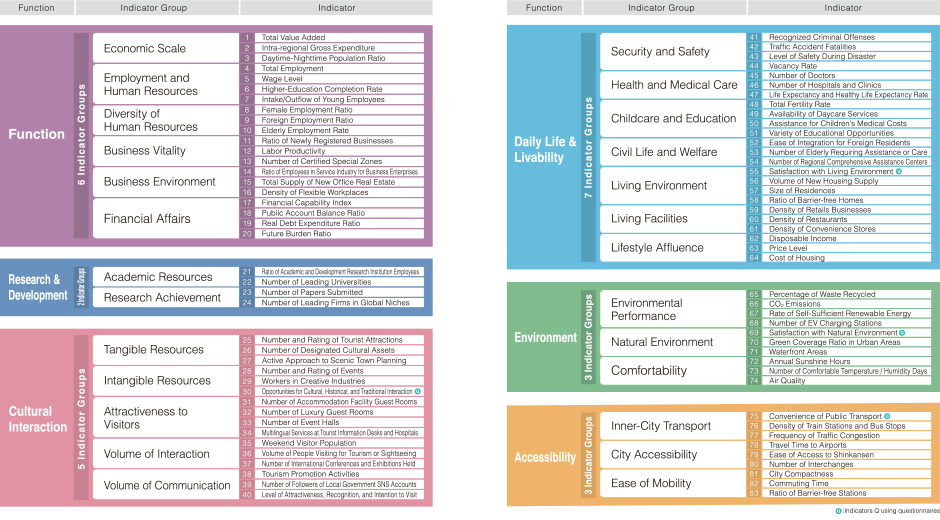
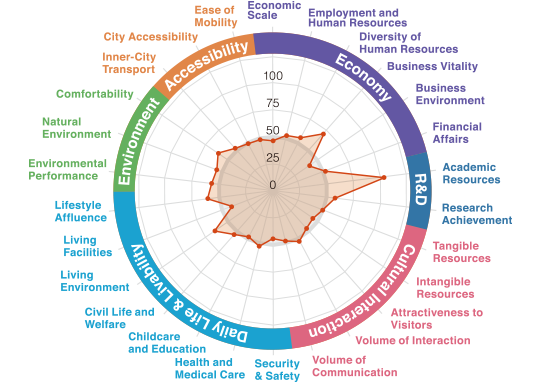
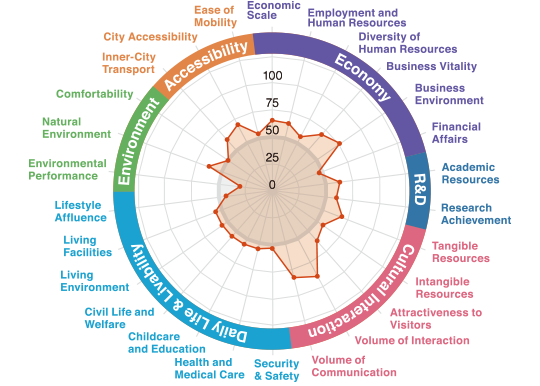
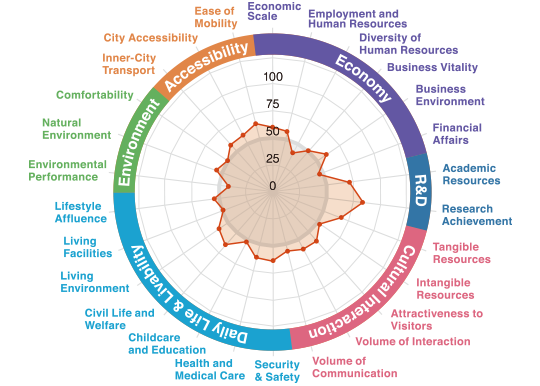
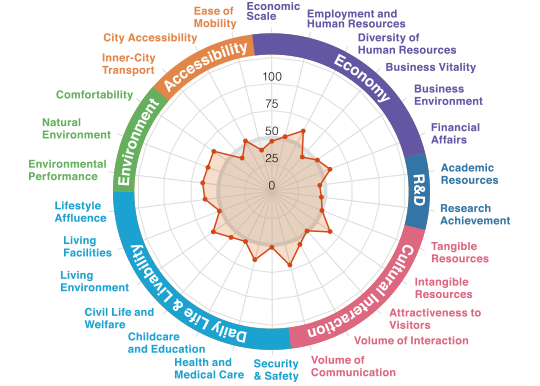
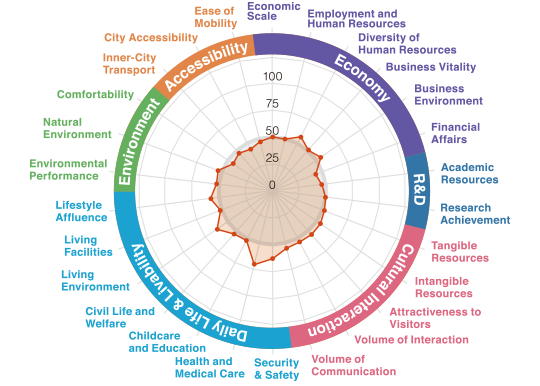
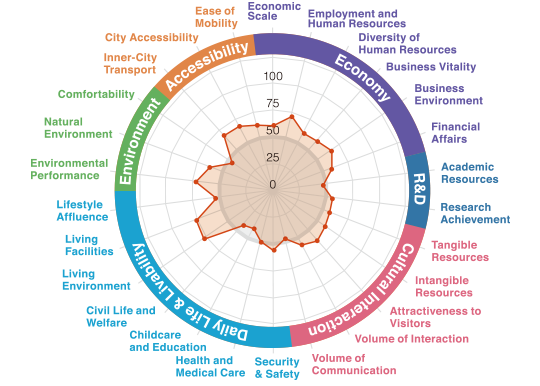
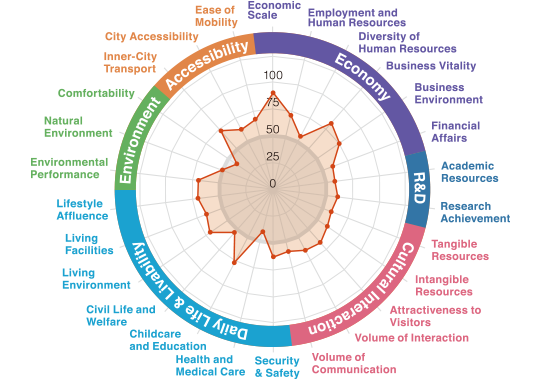
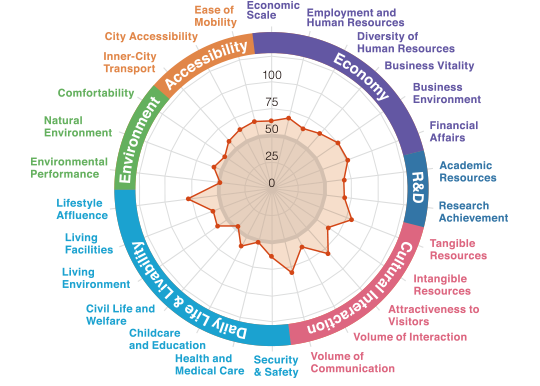
In Japan Power Cities, 6 functions (Economy & Business, Research & Development, Cultural Interaction, Daily Life & Livability, Environment, and Accessibility) were created to represent the components of cities. Furthermore, 26 indicator groups were established to represent the primary components of those functions, with 83 indicators finally being determined.
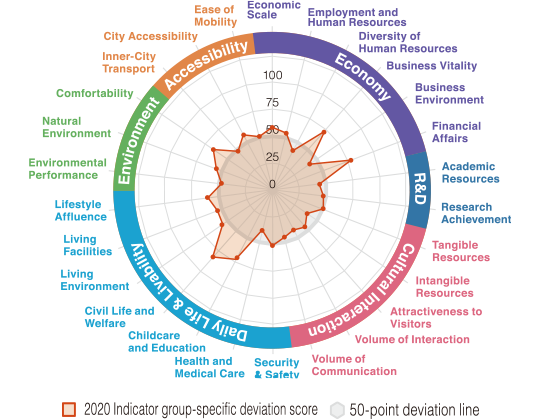
Radar charts and bar graphs were used to clarify the strengths and attractiveness of each target city in this study. The following are the examples of particularly unique cities, six of which are from 109 major Japanese cities and three from the 23 wards of Tokyo.
In the Databook 2020, you can find a city's characteristics through different data forms including indicator group-specific radar charts.
A livable city with
a strong economic base
A verdant city of science,
home to Tsukuba Science City
A balanced city boasting both
cultural appeal and economic strength
The “City of Trees” boasts
high appeal for its R&D and livability
A city blending a rich living environment
surrounded by nature and cultural appeal
A city creating peace of mind
for residents and appeal for tourists
A vibrant city boasting strengths in
transportation convenience and living environment
Tokyo’s central ward
shines in multiple areas
A balanced city that continues to evolve in
a multitude of areas centered on culture and economy
For enquiry about Japan Power Cities 2020, please contact to iusall[AT]mori-m-foundation.or.jp